From Reactive to Predictive: Using Maximo Health, Predict, and Condition-Based Maintenance
Maximo Health and Predict turn maintenance data into actionable reliability intelligence. This article explains how health scoring, predictive modeling, condition-based maintenance, and Reliability Strategies fit together in the MAS 9.x APM portfolio, with practical guidance on getting started…

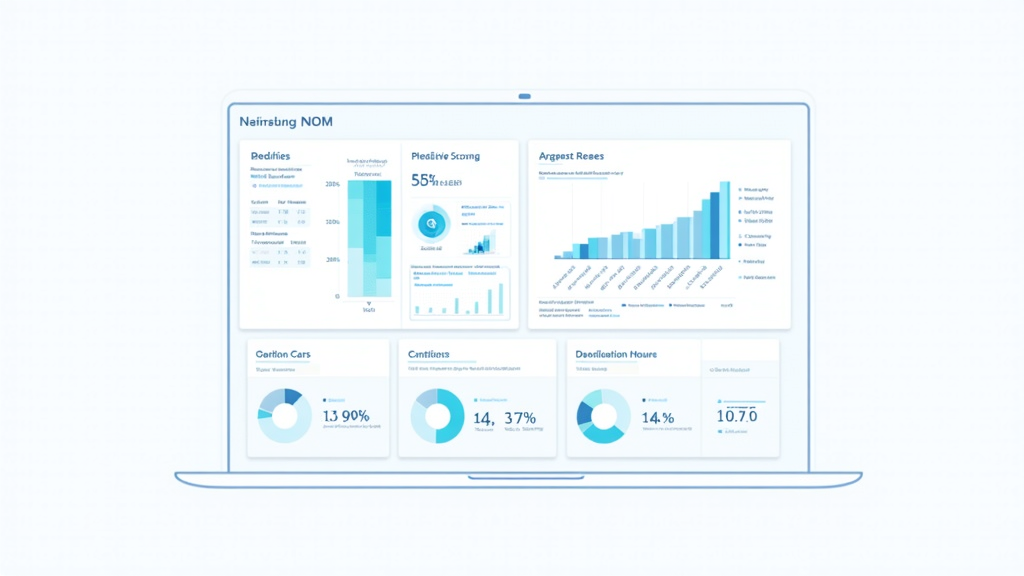
From Reactive to Predictive: Using Maximo Health, Predict, and Condition-Based Maintenance
Most organizations already collect enough asset data to move beyond reactive maintenance. Work order history, inspection results, meter readings, and sensor streams are sitting in Maximo Manage and Maximo Monitor, waiting to be turned into decisions. The gap is not data volume. The gap is a structured way to translate that data into health scores, failure probabilities, risk rankings, and maintenance actions that operations can trust.
Maximo Application Suite closes that gap through its Asset Performance Management portfolio. Maximo Health provides a view of current asset condition, criticality, and risk. Maximo Predict uses machine learning to forecast asset degradation and failure. Maximo Monitor ingests sensor data and raises alarms. Reliability Strategies provides pre-built and extensible RCM-style maintenance recommendations. Together, these applications turn Maximo from a system of record into a system of intelligence.
The 9.2 release cycle added several refinements to this portfolio. Lightweight Monitor engine scaling, configurable dashboards, new industry accelerators for electrical distribution and transmission, Weibull distribution analysis, dissolved gas analysis for transformers, and stronger integration between Reliability Strategies and Health, Job Plans, and PMs all landed in 2026. The underlying message is that APM in Maximo is no longer a set of separate products. It is becoming one continuous flow from failure analysis to maintenance strategy to monitoring to work execution.
This article is for reliability engineers and asset managers who want to build or expand an APM program without boiling the ocean. It covers the components, the scoring model, the predictive workflow, condition-based maintenance, and the practical steps for getting started with data you probably already have.
The APM Portfolio: Health, Predict, Monitor, and Reliability Strategies
The Maximo APM portfolio has four main pillars. Maximo Health assesses asset condition and risk using operational and condition data. Maximo Predict forecasts future asset behavior using machine learning models trained on historical sensor data and failure records. Maximo Monitor ingests time-series data from sensors, devices, and external systems. Maximo Reliability Strategies provides RCM-based maintenance strategy recommendations and failure mode libraries.
These applications are designed to work together. Health consumes data from Manage and Monitor. Predict consumes data from Monitor and Manage. Reliability Strategies feeds recommended maintenance actions into Health, Job Plans, and PMs. The output of the entire portfolio is a prioritized set of maintenance actions that reduce unplanned downtime, extend asset life, and optimize maintenance spend.
In MAS 9.x, IBM has tightened these connections. Sensor data can flow into asset meters and become directly visible within Health scoring and operational dashboards. Health work queues can be created in the Work Queue Manager so that maintenance planners can act on the highest-risk assets. Reliability Strategies can recommend job plans and PMs based on asset health scores and failure probabilities. The result is a closed loop: strategy informs monitoring, monitoring informs health, health informs work, and work feeds back into strategy.
This integration is the biggest architectural shift in the APM portfolio. In older approaches, reliability engineering, condition monitoring, and work management were often separate silos. Health scores lived in a spreadsheet, alarm thresholds lived in a historian, and work orders lived in Maximo. MAS 9.x brings them into the same platform, which reduces friction and makes the feedback loop practical.
How Maximo Health Builds a Score
At the center of Maximo Health is the scoring model. A health score is a normalized number, typically between 0 and 100, that represents the current condition of an asset. Lower scores mean worse condition. The score is calculated from contributors, which are the factors that influence asset health. Contributors can include work order backlog, overdue preventive maintenance, equipment age, inspection results, meter readings, failure history, and sensor-derived anomalies.
Health is only one of the scores. Criticality represents the importance of the asset to the business, often based on safety, environmental, production, and cost factors. Risk combines health and criticality to highlight assets that are both in poor condition and important to the business. A low-health asset that is not critical may still be worth monitoring, while a moderately unhealthy asset that is critical may demand immediate attention.
The scoring model is flexible. Organizations can define scoring groups for asset categories with similar behavior, such as high-voltage transformers, critical pumps, or rotating equipment. Each scoring group can have its own contributors, thresholds, and weights. A contributor for transformer health might include dissolved gas analysis results, while a contributor for pump health might include vibration trends and seal leakage inspections.
The key to a useful health score is accurate, timely data. The framework can only score what it sees. If work order history is incomplete, if meter readings are stale, or if inspection results are not entered consistently, the score will be unreliable. This is why data governance is a prerequisite for APM success. Before building complex scoring models, most organizations should clean their asset register, standardize failure codes, ensure PM completion is recorded, and make sure meter readings are entered on time.
Predictive Modeling with Maximo Predict
Maximo Predict extends Health by adding predictive analytics. It includes model templates for common reliability questions: days to failure, probability of failure, anomaly detection, and asset life curves. These models are built in IBM Cloud Pak for Data and Watson Studio, which are included with Maximo Application Suite, and they are deployed against the data that Maximo Monitor and Maximo Manage already collect.
The predictive workflow starts with data preparation. Historical sensor data is ingested by Maximo Monitor and stored as time series. Failure data comes from Maximo Manage in the form of work orders, failure codes, and asset decommissioning records. The data scientist or reliability engineer selects a model template, trains the model on historical data, and deploys it. Once deployed, the model scores assets in Health and Predict, showing which assets are likely to fail and when.
The most common use case is forecasting days to failure for a specific asset and failure mode. For example, a motor might have a history of bearing failures correlated with increasing vibration and temperature. A predictive model trained on that history can estimate the remaining useful life of the bearing and trigger a work order before the failure occurs. The maintenance planner can then schedule a replacement during a planned outage rather than responding to an emergency breakdown.
Another common use case is anomaly detection. Anomaly models learn what normal behavior looks like for an asset or a group of similar assets, then flag deviations. This is useful for assets that do not have a long failure history, because it does not require labeled failure events. An anomaly might indicate a sensor problem, an operating condition change, or an emerging mechanical issue. The flagged asset can then be reviewed by a reliability engineer or inspected before a failure develops.
The 2026 release added Weibull distribution analysis, which is a statistical method for modeling probability of failure over time. Weibull analysis is particularly useful for assets with enough failure history to estimate shape and scale parameters. It gives reliability engineers a defensible way to estimate failure probability at different ages, which feeds into replacement planning and capital budgeting.
Condition-Based Maintenance: Closing the Loop
Condition-based maintenance, or CBM, is the operational outcome of health and predictive scoring. Instead of performing maintenance on a fixed calendar schedule, CBM triggers maintenance when condition data indicates that it is needed. The goal is to reduce unnecessary maintenance on healthy assets while catching degradation before it becomes a failure.
In Maximo Application Suite, CBM is enabled by the integration between Manage, Monitor, and Health. Sensor data from Maximo Monitor flows into asset meters in Maximo Manage. Health scoring consumes those meter readings. When a health score or predictive indicator crosses a threshold, the system can generate an alert or a work order. The work order can include a recommended job plan from Reliability Strategies, which captures the appropriate tasks, materials, tools, and qualifications.
This integration is now out-of-the-box in MAS 9.x. Time-series data can be shared across applications through meters, which removes the custom integration work that used to be required. A vibration alarm in Monitor can become a meter reading in Manage, which feeds into a health contributor, which lowers the asset health score, which triggers a health work queue entry, which the planner converts into a work order using a pre-approved job plan.
The practical challenge is setting the thresholds. Too sensitive, and the system generates false alarms that erode trust. Too insensitive, and it misses failures. Thresholds should be based on historical data, engineering judgment, and a willingness to tune them over time. A good starting point is to set initial thresholds conservatively and review alarm performance monthly. Track which alerts led to real maintenance actions, which were false positives, and which failures were missed. Use that feedback to refine the model and the thresholds.
Reliability Strategies and Pre-Built Industry Accelerators
Reliability Strategies is the bridge between engineering knowledge and executable maintenance plans. It provides a library of asset-specific failure details and mitigation activities built by industry and domain experts. Organizations can use these libraries as starting points for their own reliability programs, rather than building everything from scratch.
The 2026 updates extended Reliability Strategies with AI capabilities for building failure and remediation descriptions. The connection to Health, Job Plans, and PMs was also tightened, so that strategy recommendations can flow directly into the work management system. For example, a strategy for a transformer might recommend dissolved gas analysis at a specific interval, oil filtration based on certain gas levels, and replacement based on a calculated end-of-life probability. Those recommendations can be turned into PMs and job plans in Maximo Manage.
Industry accelerators are a related asset. The 2026 release included scoring models for electrical distribution and transmission, covering health, criticality, effective age, end-of-life probability, and risk. It also added dissolved gas analysis for transformers using Duval triangle visualization. These accelerators are valuable because they encode domain expertise that would take years to develop internally. A utility that is just starting its APM program can use these models as a baseline and refine them with its own data over time.
The accelerators also show how APM is moving from generic models to industry-specific models. A health score for a transformer is not the same as a health score for a pump or a valve. The failure modes, the condition indicators, and the business consequences are different. Industry accelerators recognize that and give organizations a head start.
Getting Started Without Boiling the Ocean
The biggest mistake organizations make with APM is trying to model everything at once. They attempt to score every asset, deploy predictive models for every failure mode, and integrate every sensor before they have validated the basics. A more practical approach is to start with a focused pilot, prove value, and expand incrementally.
Step one is to select a critical asset class. Choose a class that has clear business impact, reasonable data quality, and a known failure history. Critical pumps, transformers, motors, and compressors are common starting points. Avoid asset classes with messy data or political ownership disputes for the first pilot.
Step two is to clean the data for that asset class. Validate the asset register, standardize failure codes, ensure PM completion is recorded, and confirm that meter readings are current. If you have sensor data, make sure it is mapped to the correct assets and meters. This step often takes longer than expected, but it is the foundation for everything that follows.
Step three is to define the scoring model. Start with a simple health score based on a few contributors that you trust. Overdue PMs, work order backlog, and asset age are common starting contributors. Add condition-based contributors such as meter readings or inspection results once the data is reliable. Set initial thresholds and review them monthly.
Step four is to create a response process. Decide who reviews low-health assets, how work orders are created, and what job plans are used. The scoring model is useless if nobody acts on it. The Work Queue Manager and Health work queues in Maximo Manage can help formalize this process.
Step five is to add predictive models once the health score is stable. Choose one failure mode with enough historical data to train a model. Deploy it, validate its predictions against actual failures, and refine it. Only expand to additional failure modes once the first model is trusted.
Common Pitfalls in APM Programs
The first pitfall is expecting perfect predictions immediately. Predictive models need data, and most organizations need six months to two years of clean data before they can train reliable models. Early value comes from health scoring and condition-based alerts, not from perfect failure forecasts.
The second pitfall is building models without involving maintenance experts. Data scientists can build models, but maintenance engineers know what the models should predict, what data is meaningful, and what actions are practical. APM is a team sport.
The third pitfall is ignoring model maintenance. Assets, operating conditions, and failure patterns change over time. A model that was accurate two years ago may be inaccurate today. Plan to retrain models periodically and monitor their performance.
The fourth pitfall is over-automating too soon. Automatically generating work orders from every anomaly can overwhelm the maintenance team. Start with alerts and human review, then automate the clear-cut cases once the thresholds are proven.
The fifth pitfall is treating APM as a technology project rather than a maintenance transformation. The software is important, but the real work is changing how maintenance decisions are made. That requires sponsorship from operations, clear accountability for asset health, and a willingness to act on data instead of habit.
Practical Implications
For reliability engineers, the practical implication of the MAS 9.2 APM enhancements is that the toolset is now mature enough for production programs. Health scoring, predictive modeling, condition-based maintenance, and strategy integration are no longer experimental. They are supported, integrated, and scalable.
For maintenance planners, the implication is that work priorities can be driven by asset condition and risk rather than by calendar alone. This does not eliminate preventive maintenance, but it makes it smarter. Critical assets get attention when they need it, and healthy assets are not over-maintained.
For executives, the implication is that APM can now be measured. Health scores, risk rankings, failure probabilities, and maintenance cost avoidance can be tracked and reported. This makes it possible to build a business case for APM investment and to demonstrate progress over time.
Bottom Line
Maximo Health, Predict, Monitor, and Reliability Strategies give organizations a complete APM portfolio inside the same platform that manages their work. The 9.2 release strengthens the integration between these applications and adds industry-specific models that accelerate time to value.
The path to success is incremental. Start with one critical asset class, clean the data, build a simple health score, create a response process, and only then add predictive models. Avoid the temptation to model everything at once. APM is a transformation in how maintenance decisions are made, and that transformation succeeds one trusted score at a time.
Field-Tested Pattern: Configuring a Health Score for Critical Pumps
The following example shows a practical health score configuration for a critical pump population in a water treatment facility. The goal is to produce a score that maintenance planners can trust when prioritizing daily work. The configuration uses five contributors with weights that reflect both condition data and operational history.
SCORING GROUP: CRITICAL_PUMPS_WASTEWATER
ASSET CLASS: Pumps - Wastewater Transfer and Booster
HEALTH SCORE RANGE: 0 to 100

CONTRIBUTORS:
  1. Overdue Preventive Maintenance
     Weight: 25%
     Logic: Count of overdue PMs in the last 90 days
     Threshold: 0 = 100 points, 1 = 80 points, 2 = 50 points, 3+ = 20 points

  2. Work Order Backlog
     Weight: 20%
     Logic: Count of open corrective work orders older than 30 days
     Threshold: 0 = 100 points, 1-2 = 75 points, 3-5 = 45 points, 6+ = 15 points

  3. Vibration Trend
     Weight: 25%
     Logic: Latest vibration meter reading compared to baseline
     Threshold: <= 110% baseline = 100 points, 111-125% = 70 points,
               126-150% = 40 points, > 150% = 10 points

  4. Seal Leakage Inspection Result
     Weight: 15%
     Logic: Most recent inspection result for mechanical seal condition
     Threshold: No leakage = 100 points, Minor = 70 points,
               Moderate = 40 points, Major = 10 points

  5. Pump Runtime Since Last Overhaul
     Weight: 15%
     Logic: Running hours since last major overhaul or replacement
     Threshold: <= 4,000 hours = 100 points, 4,001-8,000 = 80 points,
               8,001-12,000 = 50 points, > 12,000 = 25 points

RISK FORMULA: ((100 - health) / 100) * criticality
CRITICALITY FACTORS: Safety impact, environmental impact, production impact, replacement cost
ALERT THRESHOLD: Health < 60 triggers health work queue review
In this configuration, overdue PMs and vibration trend together account for half of the health score. That reflects the reality that missed PMs are often a leading indicator of future failure, and vibration is one of the most reliable condition indicators for rotating equipment. Seal leakage and runtime since overhaul add additional condition and age context without overwhelming the score with too many contributors.
A water utility that implemented a similar model for 120 critical pumps reported several concrete improvements within the first year. The percentage of pumps with overdue PMs dropped from 23% to 7%. Emergency pump removals fell from an average of 4.2 per month to 1.8 per month. Perhaps most importantly, maintenance planners stopped relying on memory or spreadsheets to decide which pump to work on first. The health score became the common language between operations, maintenance, and reliability engineering.
The configuration is intentionally simple. It does not use machine learning. It does not require custom code. It relies on data that the utility already collected: PM schedules, work order history, vibration meter readings, inspection results, and pump runtime hours. This simplicity is a feature, not a limitation. A simple model that people understand and trust is more useful than a complex model that produces opaque results.
When the organization was ready to add predictive analytics, the same data fed into Maximo Predict. The vibration trend and runtime history were used to train a days-to-failure model for bearing failures. The model was initially run in parallel with the health score for six months to build confidence. Once the model's predictions matched actual failures well enough, the maintenance team began using the predicted failure window to schedule overhauls during planned station shutdowns.
The lesson is that health scoring and predictive modeling are complementary, not competing. Health scoring provides an immediate, interpretable view of asset condition. Predictive modeling adds a forward-looking estimate for specific failure modes. Together they give maintenance teams both a dashboard and a forecast, which is far more powerful than either one alone.