Two Zones and One Arrow: A Six-Exercise Maximo Integration Lab, and the JMS Server Hiding in the Prerequisites
A six-exercise integration lab on MAS 9.2 draws a line through the estate: operational data on one side, business records on the other, and one arrow where an alert becomes a service request. The most useful part is the eleven-minute gap between saving an asset and delivering it.

Two Zones and One Arrow: A Six-Exercise Maximo Integration Lab, and the JMS Server Hiding in the Prerequisites
A hands-on lab that arrives as six exercises, each with a goal, the exact steps, a verification and a list of the mistakes beginners make, is easy to file under beginner material and move past. The Maximo integration lab published on IBM Community on 16 October 2026 deserves better than that, because it does something product documentation rarely does: it draws a line through a Maximo Application Suite estate and attaches a different guarantee to each side of that line.
On one side sits operational data. Temperature, pressure, vibration and flow from a cooling pump, every ten seconds, each reading individually worthless and the trend carrying all the meaning. On the other side sit business records. Assets, work orders, purchase orders, where a lost record is a financial and audit event and a duplicated record is worse than the loss. The lab builds both paths on a live MAS 9.2 system with Manage, IoT and Monitor on Red Hat OpenShift, Kafka managed by the Strimzi operator, and Confluent Platform 7.9 on a laptop for the standalone exercises. Six exercises, fifteen to twenty-five minutes each, about two hours in total.
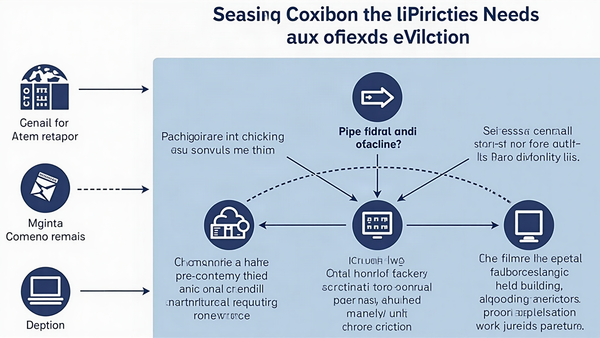
The two zones meet at exactly one point, and the author draws it as a single arrow: an alert computed from many readings becomes a service request in Manage. That arrow is where real integration projects either work or quietly rot, because it is the only place where a lossy, high-volume, eventually consistent stream has to collapse into a record with an owner, a status and an audit trail.
Then comes the paragraph that makes the piece genuinely valuable to anyone planning a project rather than running a tutorial. The queue records in External Systems are only names. Something has to exist behind them, and in MAS that means a change to the ManageWorkspace resource: a server bundle of type standalonejms, a persistent volume mounted at a path that must be exactly right, a Liberty client configuration supplied as a secret, and a rebuild that logs every user out. That is a maintenance window wearing the costume of a prerequisite, and it is the part of the design that most often gets discovered mid-project, by which time the test plan already depends on it.
The Zone Model Is the Real Contribution
Two-zone diagrams are not new. What this lab does is make the split operational: it gives each zone its own transport, its own delivery guarantee and its own failure mode, then walks a reader through both so the difference is felt rather than asserted. That is why the material lands even for architects who will never run the exercises.
The operational zone carries many small readings. The transport is MQTT into the IoT tool, then Kafka, then Monitor. Nothing in that path promises that a specific reading survives. The MQTT broker passes messages on and keeps no history. Kafka keeps them for a retention period, here one day, and only so that consumers can catch up. Monitor stores what it computes, per device type, until it is archived. If a reading is dropped somewhere in that chain, nothing breaks in an accounting sense. What breaks is a trend line, and the fix is more readings.
The business zone carries records that must not be lost and must not be applied twice. The transport is the Maximo Integration Framework with JMS queues behind it. Every message is retried, tracked and replayable. A failure stops the line rather than skipping a record, which is exactly the behaviour you want when the payload is an asset, and exactly the behaviour that produces an outage when the payload is a sensor stream and the queue fills.
Put those two sentences side by side and you have a classification test that works on any proposed interface on any estate. Ask whether the payload is a reading or a record. Ask whether applying it twice is harmless. Ask whether losing it changes a number on a trend or a line in an audit. If the answers point at business records and the proposed transport is a topic, the design is wrong. If the answers point at telemetry and the proposed transport is a sequential queue, the design will either drop readings under load or back up behind a single failing message.
The lab's own framing exposes a second, subtler failure mode: the support desk that treats save and delivered as the same event. In the business zone they are separated by a scheduled reader, and the gap is measured in minutes, not milliseconds. In this lab it was eleven minutes. Anyone who has taken a ticket saying the interface did not send an asset while the asset sat happily in the sending database has met this problem. The zone model predicts it before it happens, because it forces the question of where a message physically waits.
There is also a discipline in the diagram: the arrow is deliberately narrow. Operational data does not trickle into Manage record by record, and business records do not stream out as Kafka topics. One alert crosses. That constraint keeps the high-volume side from drowning the transactional side, and it gives the two teams a clean contract to argue about, which is the alert rule and the mapping from device to asset.
Kafka Is Not a Queue, and the Key Decides Everything
The first two exercises are about Kafka, and they are structured to correct the mental model that most people bring from messaging middleware.
The first exercise runs Confluent Platform from the published single-broker compose file, opens Control Center on port 9021, creates a topic called lab.meter.readings with three partitions, and produces five keyed JSON messages. Three of them carry the key MTR-1, one carries MTR-2, one carries MTR-3. When the messages are read back across all partitions, the three MTR-1 readings sit together in partition 2 at offsets 0, 1 and 3, in the order they were sent. MTR-2 lands in partition 1. MTR-3 lands in partition 2 at offset 2, sharing a partition with a different key.
That single table teaches three things at once. The partition is decided by hashing the key, so identical keys always land in the same partition. Order is guaranteed inside a partition and nowhere else. And more than one key can share a partition, which means the guarantee you get is per key, not per partition. The design rule that follows is the one that matters at scale: choose a key such that everything which must stay in order shares it. A meter number, a pump identifier, an asset number. What you must never do is leave the key null and assume the broker will preserve sequence, because with partitioning it will not.
The same exercise then introduces ksqlDB as a reader rather than as a curiosity. A stream is declared over the topic with the meter as key and three fields, three more readings are inserted from SQL, and a persistent query filters readings above five into a new stream. The result is two rows, both from MTR-3, one at 7.9 and one at 8.4, which is exactly right: those are the only readings above the threshold, and the query is a Kafka consumer like any other, visible in the Consumers view under its generated group name.
Then the lesson that separates Kafka from JMS. Running a Python consumer with group id demo-readers reads all five messages. Running the same consumer with the same group immediately afterwards reads zero, because that group's bookmark has moved past the end. Running it with a different group id, audit-team, reads all five again. Reading does not delete. A topic is a log with bookmarks per group, not a queue with competing consumers.
The second exercise repeats the pattern on the Kafka that ships inside MAS, which is the version a project will actually use. The topic is created as a KafkaTopic resource against the Strimzi cluster, three partitions and three replicas, retention set to one day in milliseconds. The client connects over an external route on port 443 with SASL_SSL and SCRAM-SHA-512, using a username, a password and the cluster CA certificate. Producing five messages with pump keys returns partition assignments of 1, 2, 1, 0 and 1, which is the hash doing its work again, and demonstrates that a consumer connecting from a laptop cannot use the internal service address, only the route.
The commercial argument for this model is buried in the same exercise. Because messages persist for the retention period, a second system can be connected a week later and read history it never subscribed to. That is how one topic feeds Monitor, a data lake and a streaming filter simultaneously, and it is why the lab can add an audit reader without touching the sender. Try the same thing with a JMS queue and the message is gone the moment the first reader takes it.
MQTT, Monitor and the Path Where Only the Trend Survives
The third exercise is the one that explains why the suite puts Kafka behind MQTT instead of exposing Kafka to devices, and the answer is physical rather than architectural: MQTT suits thousands of small, weak, intermittently connected devices, each with its own identity and its own token, while Kafka suits applications in a data centre and keeps history so a consumer can stop and catch up.
The lab registers a device type called CoolingPump with four number metrics on the status event: temperature, pressure, vibration and flow. The metric name must match the field name in the JSON the device sends, which sounds trivial until a device team sends a field called temp and every value arrives with an empty metric beside it. The device is then created with identifier PUMP-001 and an auto-generated token that is displayed exactly once, which is the sort of sentence that should be read as an instruction rather than a description.
Publishing uses the standard IoT conventions. Host is the workspace messaging endpoint on port 443. The client id encodes workspace, device type and device identifier, here d:wsp:CoolingPump:PUMP-001. The username is always use-token-auth and the password is the device token. The topic is iot-2/evt/status/fmt/json. The Python client publishes a reading every ten seconds with quality of service 1, and the recent events tab in Monitor shows each message exactly as sent.
The part worth carrying into a design review is what happens next. The broker keeps no history, but the IoT tool writes every message into the suite's device event topic, and that topic is a Kafka topic like the one built by hand in the previous exercise. Its key holds workspace, device type, device identifier and event name, which is precisely the key design the first exercise argued for: every reading from one pump stays in one partition, in order, because the key never changes. Telemetry ordering is not achieved by configuration. It falls out of a sensible key, and the suite has already made that choice for you.
The failure modes in this exercise are all identity problems rather than protocol problems. A client that connects and drops immediately has a client id that does not match the registration, where type and identifier are case sensitive, or a wrong token. A connection that flips on and off has two programs using the same client id, because MQTT allows one connection per identity. That second one is worth flagging to operations teams, because a duplicate simulator left running on a laptop looks exactly like a flaky network and will be diagnosed as one for a week.
Monitor then becomes the first place where the data acquires meaning rather than volume. A calculated metric of type AlertHighValue is added to the device type, scoped to all devices of that type, with vibration as input, an upper threshold of 3.5, severity High and an output name of vibration_high. One rule on the device type covers every pump of the type, which is the right granularity: a threshold per device is an exception, not a default. The trend view draws the hourly highest and lowest value, so a simulated failing bearing appears as a rising peak rather than as noise.
The Arrow: One Alert, One Service Request
The fourth exercise is short and carries the whole architecture. The alerts dashboard on the device type lists vibration_high alerts after a few minutes, and each row ends with a create service request link that opens the record in Manage. The delay is worth understanding: Monitor computes in batches, not instantly, so a rule that fires from a live stream will still take minutes to appear. Teams that build a safety case on sub-minute alerting from calculated metrics are building on the wrong schedule.
The more important lesson is about volume at the boundary. The naive rule fires for every reading above the limit, and the lab names the consequence explicitly: ninety alerts for one problem. The fixes are the ones that belong in a design document rather than in a tutorial. Alert on the hourly maximum, or switch to AlertByOccurrencesCount so that the condition has to persist before it becomes an alert.
That single design decision determines whether the arrow is useful or destructive. Ninety alerts become ninety service requests in Manage, each with an owner, a status and a work order number, and the business zone is now carrying operational noise at record quality. The arrow is not a pipe. It is a compression step and a semantic translation, and the compression has to happen on the operational side, before the boundary, because the business side has no concept of a reading that does not matter.
The lab's own next steps list a third, quieter requirement: link the Monitor device PUMP-001 to the Manage asset PUMP-001, so that alerts open work against the right asset. That is a mapping, not a configuration, and it is the difference between a service request that a planner can action and one that says a device nobody can locate has high vibration. On a real estate with thousands of devices, that mapping is a data management project of its own, and it belongs on the critical path rather than in a hardening phase.
Read together, these three points give the boundary its contract. The alert must represent a condition rather than a reading, it must reference an asset rather than a device, and it must be rare enough that a human can act on every instance. Where any of those fails, the arrow delivers operational data into a system designed for records, and the resulting queue is a maintenance backlog with extra steps.
The Business Zone: MIF, Queues and an Eleven-Minute Gap
The fifth and sixth exercises are where the lab earns its keep for administrators, because they show an outbound and an inbound message and a deliberate failure that has to be repaired before the record arrives.
The outbound path starts with an external system called DEMOERP, an end point of MXXMLFILE that writes each outbound message to a file, queues selected from the lookups, and the system enabled. The MXASSETInterface publish channel and enterprise service are added and enabled, the event listener is switched on, and message tracking with message storage is ticked on the channel. Then an asset is created in Manage and saved. Nothing on screen says a message was produced, which is the first surprise for anyone used to a synchronous API.
Checking the queue is the second surprise. The message is sitting in the sequential output queue, and it does not move, because nothing is reading it. The reader is a cron task, JMSQSEQCONSUMER, with instances SEQQOUT and SEQQIN set active, and each active instance reads one sequential queue roughly every thirty seconds. Once switched on, the XML file appears in the Manage pod and message tracking shows the message as processed, with the original stored.
The timestamp on that last step is the single most instructive fact in the whole lab. The asset was saved at 06:18 and the file was written at 06:29, because the message waited in the queue until the reader was enabled. Eleven minutes of separation between a database commit and an external delivery, with no error anywhere, no backlog warning and no visible symptom apart from the partner not having the record.
That is what asynchronous means in practice, and it is the reason an integration monitoring standard should record delivery timestamps and not just save timestamps. It is also the reason a support desk cannot treat a complaint that the interface did not send as evidence of a defect: the correct first check is queue depth and message tracking, in that order, before anyone opens a log.
The inbound exercise completes the picture and supplies the best error message in the set. An XML file with a single asset is imported through the enterprise service, and Manage answers that it was processed successfully to the queue. On a fresh system the asset does not appear, because the inbound message runs as a user, and that user is not authorised for the MXASSET object structure. The failure surfaces in Message Reprocessing as an authorisation error against the object structure, and the fix is to configure object structure security with the authorisation name set to ASSET, then replay the message.
Three principles fall out of that one exercise. Accepted is not processed. A failed message is not lost, it waits for a fix and a replay. And because a sequential queue stops at the first failing message, everything behind it waits as well, which is why a single unauthorised import can look like a total interface outage.
The JMS Server Is a Change Request, Not a Checkbox
The appendix is where the lab stops being a tutorial and starts being project advice, because it describes the precondition that most MAS integration work discovers late: in MAS, the queue records in External Systems are only names, and a messaging server has to exist behind them.
The declaration lives in the ManageWorkspace resource and has four parts. A server bundle of type standalonejms with a single replica. A persistent volume of 5 GiB with ReadWriteMany access, mounted at /jmsstore. An additional server configuration on the default bundle, supplied as a secret containing a Liberty client XML that maps each JNDI name to a queue, along with the connection factory and activation specifications. And defaultJMS set to true so the continuous-queue message beans are enabled.
Any change to that resource rebuilds the Manage images and restarts Manage, which logs users out. Plan a maintenance window, and plan it early, because the test plan for every inbound and outbound interface depends on this being in place. When the workspace page shows every tile green, the JMS pod is holding its message store on the mounted volume, with the log, permanent store and temporary store files beside the queue definitions.
The three traps in that appendix are worth memorising. Setting defaultJMS to true on its own does not create a JMS server, which is the mistake that produces an enabled external system and a queue count that never moves. The volume must be mounted at /jmsstore and not at /jms, a difference of five characters that produces a server with nowhere to store messages. And every queue definition in the client XML needs an identifier, or the activation specifications fail to start with Liberty errors that mention the configuration and the resource adapter rather than the missing attribute.
The wrap-up table is the artefact to copy into a design document, because it states durability per technology in one place. MQTT stores nothing durable; the broker passes the message on and the IoT tool writes it to Kafka. Kafka stores segment files per partition on each broker for the retention period, read by every consumer group at its own offset. Monitor stores what it computes in its database per device type until archived. A JMS queue holds a message in the server's store until a reader takes it, and then it is gone. MIF history lives in the tracking and reprocessing tables until purged, which is the only reason a delivered message can be investigated at all.
Practical Implications
Treat the zone classification as a gate in design review, not a diagram. For every proposed interface, ask whether the payload is a reading or a record, whether applying it twice is harmless, and whether its loss changes a trend or an audit. Interfaces that fail the test on the wrong transport get redesigned before they are built, which is materially cheaper than discovering it when a sequential queue fills with telemetry.
Decide keys deliberately on the operational side. Kafka guarantees order inside a partition only, so the key must group everything that has to stay in order. Asset number or meter number is usually the correct choice, and the suite already uses workspace, device type, device identifier and event for its device event topic. Copy that pattern rather than inventing one.
Put the JMS server provisioning on the critical path. It is a ManageWorkspace change with an image rebuild and a user logout, so it needs a window, an administrator with cluster rights and a rollback plan. A project that leaves it until integration testing loses a week and a maintenance slot.
Design the arrow for rate, not for capability. Alert on conditions the business can action, use hourly maximums or occurrence counts instead of raw thresholds, and link every device to an asset before go-live. The boundary is where operational volume becomes record quality, and it will do so at whatever rate you configure.
Instrument delivery, not just saves. Record queue depth, message tracking and reprocessing counts, and compare them to save timestamps in the same dashboard. The eleven-minute gap in this lab was benign; the same gap in a billing or safety interface is the difference between a compliant record and a late one.
Bottom Line
The integration half of MAS is usually taught as a list of components: Kafka, MQTT, Monitor, MIF, JMS. This lab teaches it as a set of guarantees, which is the more useful framing because it predicts where production incidents will happen.
Readings are cheap, numerous and disposable; records are expensive, singular and auditable. Everything else follows from that, including the choice of transport, the choice of key, the need for alert deduplication before the boundary, and the requirement that the messaging server exists before anyone tests an interface. The eleven-minute gap between saving an asset and delivering it is not a defect in the lab. It is the honest shape of asynchronous integration, and any design that assumes otherwise is a design that will be debugged by someone at two in the morning. A team that spends two hours on these six exercises, and one maintenance window on the JMS server, arrives at go-live with a mental model instead of a list of endpoints.