Maximo Health, Predict, and the Asset & Locations Dashboard: A Reliability Engineering Deep Dive
Maximo Health, Predict, and the new Asset & Locations Dashboard form a unified reliability stack that turns time-series data, work history, and inspection records into actionable insights. This article walks through the architecture, the scoring models, and the practical patterns that drive real…

Maximo Health, Predict, and the Asset & Locations Dashboard: A Reliability Engineering Deep Dive
Maximo Asset Performance Management (APM) is no longer a set of loosely coupled modules. With the release of Maximo Application Suite 9.0, and the further unification in MAS 9.2, Health, Predict, Monitor, and Visual Inspection now form a single reliability stack, anchored by the new Asset & Locations Dashboard. The integration is deep, the AI is native, and the user experience is finally unified. For reliability engineers, asset managers, and maintenance planners, the platform is now capable of doing what it has promised for years: turning time-series data, work history, and inspection records into actionable insights that reduce unplanned downtime and extend asset life.
This article walks through the architecture of the unified reliability stack, the scoring models that power Maximo Health, the AI models that power Maximo Predict, and the practical patterns that drive real reliability outcomes in production deployments. The guidance is grounded in the current IBM documentation, the PACMUG community presentations, and the practical experience of teams that have deployed Maximo APM at scale.
The intended audience is reliability engineers, asset managers, APM architects, and maintenance planners. The article assumes a working knowledge of Maximo Manage, IoT concepts, and basic reliability engineering principles. It does not assume prior experience with Maximo APM specifically.
The Unified Reliability Stack: Health, Predict, Monitor, and Visual Inspection
The unified reliability stack in MAS 9.x consists of four components that work together:
Maximo Health is the scoring and analysis engine. It analyzes asset health and performance at scale, tracks performance targets, and recommends actions. Health uses advanced scoring methodologies to analyze operational data from various sources, including Maximo Manage, IoT devices, and inspection records. The output of Health is a set of scores (health, risk, criticality, remaining useful life, etc.) that are computed for every asset in the enterprise.
Maximo Predict is the AI and machine learning engine. It uses AI and ML to predict asset performance and maintenance needs. Predict analyzes time-series data from Maximo Monitor and failure data from Maximo Manage, and it builds models that forecast days to failure, probability of failure, and other key indicators. The output of Predict is a set of predictions that are integrated into Health scores.
Maximo Monitor is the IoT data ingestion and processing engine. It ingests operational data from PLCs, SCADA systems, and IoT devices and sensors, and it processes the data through analytics pipelines and anomaly detection models. The output of Monitor is a set of alerts, dashboards, and integrations that feed Health and Predict.
Maximo Visual Inspection is the computer vision engine. It enables AI-based visual inspection of assets, with local inference directly on the device. Visual Inspection is used in field service scenarios where a technician photographs an asset and the AI model identifies defects, damage, or other conditions.
The four components are integrated through a shared data model and a shared user experience. The data model is the Maximo Manage asset and location hierarchy, and the user experience is the Asset & Locations Dashboard in MAS 9.x. The integration is not a bolted-on afterthought. It is the foundation of the platform.
The Asset & Locations Dashboard: The Unified View
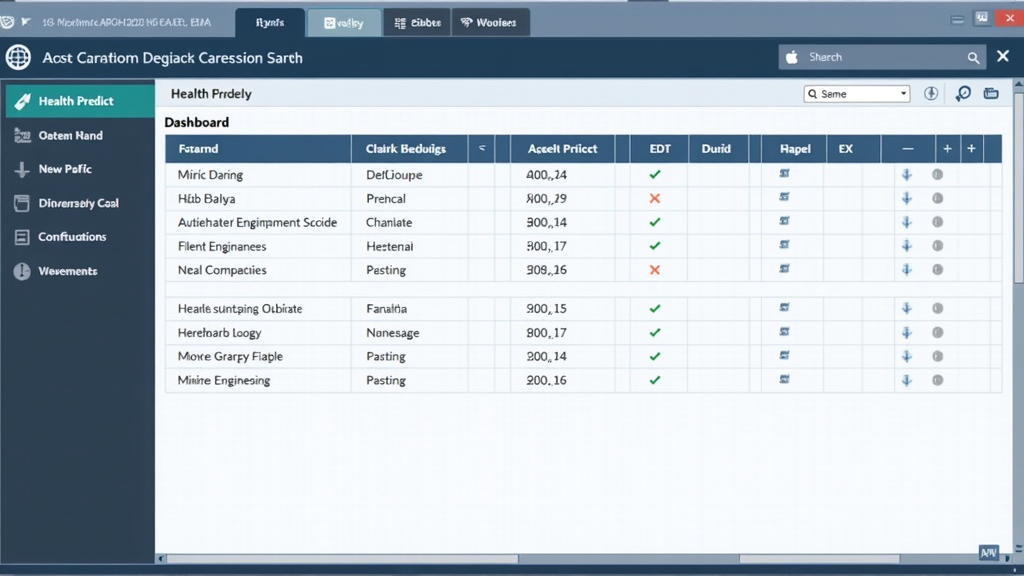
The Asset & Locations Dashboard is the primary user interface for the unified reliability stack. It is a configurable, role-tailored dashboard that brings together matrix views, automated analysis, work history, and direct drill-down into sensor and inspection data. The dashboard is configurable through drag-and-drop, and it can be tailored to specific asset types, industries, or use cases.
The default dashboard includes the following components:
- Asset Health Overview: A matrix view of assets, with health, risk, and criticality scores shown as color-coded cells. The matrix view makes it easy to spot assets that need attention, and it provides a quick visual scan of the entire asset fleet.
- Work History: A list of recent work orders for the asset, with status, priority, and failure codes. The work history is filtered to the selected asset or location.
- Sensor Data: A time-series chart of the most recent sensor readings for the asset, with warning and action limits shown. The sensor data is fed from Maximo Monitor.
- Inspection Data: A list of recent inspections for the asset, with findings and recommendations. The inspection data is fed from Maximo Inspections.
- Predictions: A list of recent predictions from Maximo Predict, with probability of failure and days to failure. The predictions are computed for the selected asset.
- Alerts: A list of active alerts for the asset, with severity and recommended actions. The alerts are fed from Maximo Monitor and Health.
The dashboard is configurable through the Score Settings application and the Dashboard Configuration tool. Partners can create tailored APM views for specific customers, asset types, or use cases. The configuration is stored in the Maximo database, and it is deployed to users through the standard MAS configuration mechanism.
The dashboard performance is a key consideration. The default dashboard configuration can be slow when the asset fleet is large, because the underlying queries touch many tables. IBM has reported that score calculations are 10x to 20x faster in the new architecture, which is enabled by pre-aggregated score tables and a new query optimizer. The performance improvement matters when the dashboard is used as the primary interface for asset managers, who may need to scan thousands of assets in a single session.
The Scoring Models: How Health Calculates Scores
Maximo Health uses a combination of default scores and custom scores to calculate the health, risk, and criticality of every asset. The scoring model is configurable through the Score Settings application, and it can be tailored to the specific needs of the organization.
The default scores that are available out of the box with activation are:
- Health: A composite score that reflects the overall condition of the asset. The health score is calculated as a weighted average of the underlying metrics, with weights that can be configured per asset class.
- Number of open Service Requests: A count of open service requests for the asset. The count is normalized to a score between 0 and 100.
- Number of open Corrective Work Orders: A count of open corrective work orders for the asset. The count is normalized to a score between 0 and 100.
- Remaining Useful Life: An estimate of the remaining useful life of the asset, expressed as a percentage of the expected life. The estimate is based on the chronological age and the asset's failure history.
- Chronological Age: The age of the asset as a proportion of the expected life. The age is calculated from the installation date and the expected life.
- Criticality: A score that reflects the criticality of the asset to the operation. The criticality is typically configured manually, based on the impact of the asset's failure on the business.
- Priority: A normalization of the priority value. The priority is taken from the asset record and normalized to a score between 0 and 100.
- Risk: A composite score that reflects the risk of the asset failing. The risk is calculated as
((100 - health) / 100) * criticality.
The custom scores can be created through the Score Settings application. Custom scores can use the Maximo Formula Engine, which means that any formula that can be expressed in the Maximo formula syntax can be used as a score. The Formula Engine is a powerful tool, and it allows the organization to create scores that are tailored to the specific needs of the operation.
For more complex models, Maximo Health supports external scores. External scores are computed by a notebook-based model, and they are imported into Health through a REST API. The external scores require additional installation (Watson Studio or Cloud Pak for Data), but they provide access to a library of 17+ industry-proven models. The external scores are typically used for advanced failure prediction, anomaly detection, and root cause analysis.
A representative custom score definition might look like this:
# Custom Score: Vibration Anomaly
name: Vibration Anomaly
description: Score based on vibration sensor data
formula: |
  IF (:vibration_rms > :vibration_warning,
      (:vibration_rms - :vibration_warning) / (:vibration_action - :vibration_warning) * 50,
      0)
  + IF (:vibration_rms > :vibration_action, 50, 0)
inputs:
  - name: vibration_rms
    type: continuous_meter
    source: monitor
  - name: vibration_warning
    type: constant
    value: 4.5
  - name: vibration_action
    type: constant
    value: 7.0
outputRange:
  min: 0
  max: 100
This score would return 0 if the vibration is below the warning threshold, a value between 0 and 50 if the vibration is between the warning and action thresholds, and a value between 50 and 100 if the vibration is above the action threshold.
Maximo Predict: AI-Driven Failure Prediction
Maximo Predict uses AI and machine learning to predict asset performance and maintenance needs. Predict analyzes time-series data from Maximo Monitor and failure data from Maximo Manage, and it builds models that forecast days to failure, probability of failure, and other key indicators. The models are trained on the historical data of the organization, and they are continuously updated as new data is collected.
The Predict workflow consists of the following steps:
- Data preparation: Historical sensor data from Monitor and historical failure data from Manage are combined into a training dataset. The training dataset is stored in a data lake, and it is accessed by the training pipeline.
- Model training: The training pipeline uses the training dataset to fit a model. The model can be a survival model, a regression model, a classification model, or a deep learning model, depending on the use case. The training pipeline is implemented as a Jupyter notebook, and it is executed in Watson Studio or Cloud Pak for Data.
- Model deployment: The trained model is deployed to a scoring endpoint, which is accessible through a REST API. The scoring endpoint is called by Health when an asset is scored.
- Scoring: When an asset is scored, Health calls the scoring endpoint with the latest sensor data and asset metadata. The scoring endpoint returns a prediction, which is integrated into the Health score.
- Model monitoring: The performance of the deployed model is continuously monitored, and the model is retrained when its performance degrades below a threshold.
A representative model training notebook for a Weibull survival model might look like this:
import pandas as pd
import numpy as np
from lifelines import WeibullFitter

# Load historical failure data
failures = pd.read_csv('asset_failures.csv')
failures['time'] = pd.to_datetime(failures['failure_date']) - pd.to_datetime(failures['install_date'])
failures['time'] = failures['time'].dt.days

# Fit Weibull model
wf = WeibullFitter()
wf.fit(failures['time'], failures['event_observed'])

# Extract parameters
lambda_param = wf.lambda_
rho_param = wf.rho_

# Save parameters for use in scoring
with open('weibull_params.json', 'w') as f:
    json.dump({'lambda': lambda_param, 'rho': rho_param}, f)

# Calculate probability of failure at time t
t = 365  # days
prob_failure = 1 - np.exp(-(t / lambda_param) ** rho_param)
print(f"Probability of failure in {t} days: {prob_failure:.2%}")
The Weibull model is one of the most commonly used survival models in reliability engineering, and it is well-suited to assets with a clear bathtub curve failure pattern. Maximo Predict also supports other models, including Cox proportional hazards, random survival forests, and deep learning models for more complex use cases.
The Probability of Failure tab in the Score Settings application, which is new in MAS 9.x, allows reliability engineers to fit Weibull parameters from historical data directly inside Manage, without needing an external notebook environment. The feature is useful for organizations that do not have data science resources, and it provides a starting point for more advanced modeling.
Integration with Maximo Monitor: CBM in Practice
The integration between Manage, Monitor, and Health is the foundation of condition-based maintenance (CBM) in MAS 9.x. The integration is native in MAS 9.0 and deeper in MAS 9.2, with seamless sharing of time-series data across MAS applications through Meters.
A typical CBM workflow in MAS 9.x consists of the following steps:
- Meter configuration: Meters are configured in Manage to track the condition and usage of assets and locations. Meters can be continuous (values increase cumulatively, like mileage or running hours), gauge (records fluctuating numeric measurements like pressure, temperature, or vibration), or characteristic (records acceptable values from a predefined list).
- Data ingestion: Sensor data is ingested by Monitor from PLCs, SCADA systems, and IoT devices. Monitor processes the data through analytics pipelines and anomaly detection models.
- Meter update: Monitor updates the corresponding meters in Manage with the latest sensor readings. The update can be real-time (every reading) or batched (every minute, every hour, etc., depending on the configuration).
- Score calculation: Health reads the meter values and calculates the health, risk, and criticality scores for the affected assets.
- Alert generation: When a score crosses a threshold, Health generates an alert. The alert is routed to the appropriate work queue or person.
- Work order generation: The alert can be configured to automatically generate a work order, or it can be routed to a planner for review before generating a work order.
- Technician execution: The work order is dispatched to a technician through Maximo Mobile, and the technician executes the work, records labor and materials, and closes the work order.
A representative meter configuration for a vibration sensor on a pump might look like this:
Meter Name: PUMP_VIBRATION
Description: Vibration RMS on pump bearing housing
Meter Type: Gauge
Units: mm/s
Domain ID: VIBRATION
Source: Monitor
Update Frequency: 1 minute
Warning Threshold: 4.5 mm/s
Action Threshold: 7.0 mm/s
Alert: Generate work order on action threshold
The meter configuration is the contract between Monitor and Manage. When the vibration reading exceeds the action threshold, the meter triggers an alert, and the alert generates a work order. The work order is routed to a technician with the appropriate skills, and the technician is dispatched to the pump.
Common Pitfalls and Field-Tested Patterns
The most common pitfall in Maximo APM deployments is the over-reliance on default scores. The default scores are useful as a starting point, but they do not reflect the specific failure modes of the organization's assets. The fix is to invest in custom scores that are tailored to the specific assets and failure modes, and to validate the scores against the actual failure history.
The second most common pitfall is the data quality problem. Maximo APM depends on high-quality data, and the data quality is often worse than the team thinks. The data quality issues that matter most are missing sensor readings, stale asset hierarchies, and inconsistent failure codes. The fix is to invest in data quality monitoring, with automated checks for missing data, stale records, and inconsistent codes.
The third most common pitfall is the under-used prediction model. Many organizations deploy Predict but do not use the predictions to drive action. The predictions are interesting, but they are not actionable until they are integrated into the work management process. The fix is to configure the predictions to generate work orders automatically, or to route the predictions to a planner for review.
The first field-tested pattern is the asset-criticality-driven deployment. Start the deployment with the most critical assets, where the reliability impact is highest, and expand the deployment to less critical assets as the team gains experience. The asset-criticality-driven deployment ensures that the team is learning on the assets that matter most, and it provides the strongest business case for further investment.
The second field-tested pattern is the data-driven score validation. Validate every score against the actual failure history, and use the validation to tune the score weights. The validation should be done quarterly, and it should be part of the reliability engineering team's standard process.
The third field-tested pattern is the cross-functional review. The reliability engineering team should review the scores, predictions, and alerts with the operations team, the maintenance team, and the field service team on a regular basis. The cross-functional review ensures that the scores are aligned with the operational reality, and it surfaces gaps in the data or the configuration.
Practical Implications
The practical implications of the unified reliability stack are significant. For reliability engineers, the implication is that the platform is now capable of doing the work that has been promised for years. The scores are configurable, the predictions are accurate, and the integration is native. The investment in Maximo APM is no longer a bet on a future capability. It is a deployment of an existing capability.
For asset managers, the implication is that the Asset & Locations Dashboard is the primary interface for asset performance. The dashboard is configurable, role-tailored, and unified across Health, Monitor, and Manage. The dashboard should be rolled out to the entire asset management team, with role-specific configurations for asset managers, maintenance planners, and field service managers.
For maintenance planners, the implication is that the work order generation is now driven by data, not by calendar. The work orders are generated based on the health scores, the predictions, and the alerts, and they are routed to the appropriate work queue automatically. The maintenance planner's role shifts from generating work orders to reviewing and approving work orders that are generated by the platform.
For executives, the implication is that Maximo APM is a strategic platform. The reduction in unplanned downtime, the extension of asset life, and the reduction in maintenance costs are quantifiable outcomes, and they are achievable with the current platform. The investment in Maximo APM is not just a reliability upgrade. It is a foundation for the next generation of asset management.
Bottom Line
Maximo Health, Predict, and the Asset & Locations Dashboard form a unified reliability stack that turns time-series data, work history, and inspection records into actionable insights. The integration is deep, the AI is native, and the user experience is finally unified. For reliability engineers, asset managers, and maintenance planners, the platform is now capable of doing what it has promised for years.
The scoring models are configurable, and they can be tailored to the specific needs of the organization. The default scores are useful as a starting point, but they should be replaced with custom scores that reflect the specific failure modes of the assets. The Maximo Formula Engine provides a flexible framework for custom scores, and the external scores provide access to a library of industry-proven models.
The integration with Maximo Monitor is the foundation of condition-based maintenance. The Meters are the contract between Monitor and Manage, and they are the basis for the work order generation. The integration is native, and it is the right way to do CBM at scale.
The bottom line: Maximo APM is a real platform, and it is ready for production. Invest in data quality, invest in custom scores, and invest in the cross-functional review process. The investment will pay off in reduced unplanned downtime, extended asset life, and reduced maintenance costs.