Building a Condition-Based Maintenance Loop with Maximo Health, Predict, and Reliability Strategies
A practical guide to closing the condition-based maintenance loop in MAS using Health scoring, Monitor meter data, Predict models, Reliability Strategies content, and Manage work execution.

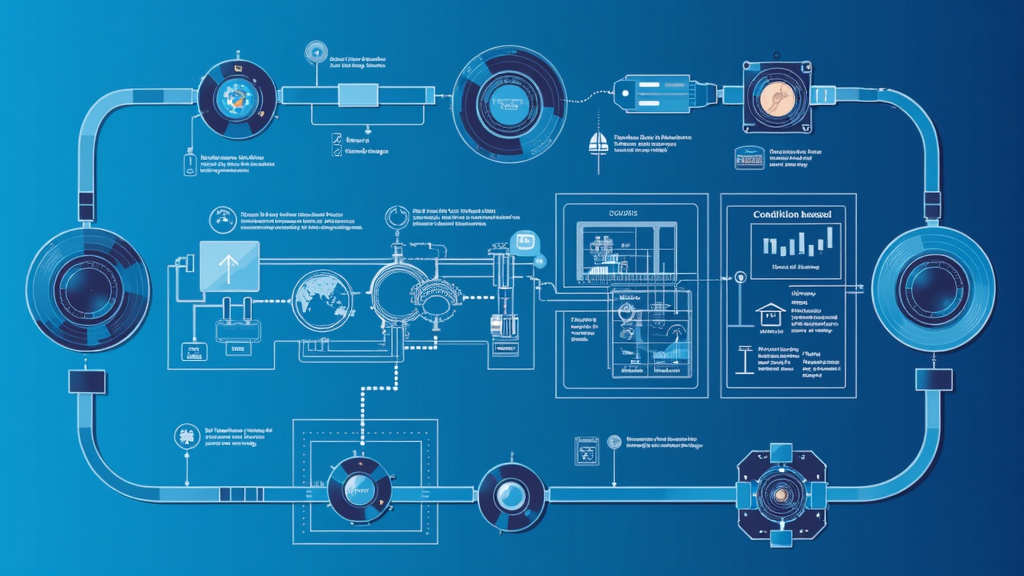
Building a Condition-Based Maintenance Loop with Maximo Health, Predict, and Reliability Strategies
Condition-based maintenance has been a goal of asset-intensive organizations for decades, but the gap between sensor data and work execution has remained stubbornly wide. Data sits in historians, SCADA systems, or IoT platforms, while maintenance planners still work from calendars and run-hour counters. The promise of doing the right work at the right time has been limited by integration friction, unclear ownership, and models that produce interesting charts but no actionable work orders. In the MAS 9.x releases, IBM has tightened the integration between Maximo Monitor, Health, Predict, and Manage to the point where a genuine closed-loop condition-based maintenance workflow is achievable without custom point-to-point integrations.
This article explains how to build that loop. We will start with the conceptual flow from sensor data to work order, then look at each component in depth: Monitor for data ingestion and anomaly detection, Health for scoring and condition context, Predict for failure forecasting, Reliability Strategies for maintenance strategy selection, and Manage for execution. The focus is practical implementation rather than product marketing. The goal is to give reliability engineers and APM administrators a clear blueprint they can adapt to their own assets.
The Closed-Loop CBM Concept
A closed-loop condition-based maintenance system has five stages. First, collect operational data from the asset. Second, turn that data into condition insight through scoring or anomaly detection. Third, forecast when the asset is likely to fail or degrade beyond acceptable limits. Fourth, decide the right maintenance strategy based on the condition and the asset's criticality. Fifth, execute the work and feed the results back into the models. Each stage needs the previous stage to be trustworthy, and the loop only works if the output of the last stage improves the input to the first.
In MAS, the stages map to applications. Maximo Monitor collects and unifies operational data. Maximo Health scores asset condition and tracks performance targets. Maximo Predict builds models that forecast failure probability or remaining useful life. Reliability Strategies provides a library of asset-specific maintenance strategies and failure modes. Maximo Manage executes the resulting work orders, captures the actual failure and repair data, and stores it for future model training. The integration between these applications is built in, but the design decisions are still the organization's responsibility.
The loop does not have to be fully automatic to be valuable. In many organizations, the most effective starting point is a human-in-the-loop design where Health raises the flag, Predict ranks the candidates, Reliability Strategies suggests the intervention, and a planner decides whether and when to act. Over time, as confidence grows, more of the decision can be automated. Trying to automate everything on day one is a common failure pattern.
Maximo Monitor: From Sensor Data to Condition Signals
Maximo Monitor is the data ingestion and processing layer. It connects to PLCs, SCADA systems, historians, and IoT devices, normalizing the data into metrics and devices within the Monitor asset model. For condition-based maintenance, the key output of Monitor is not the raw time-series chart but the meter reading or anomaly signal that can be consumed by Health and Predict.
The integration pattern is through meters in Maximo Manage. Monitor can populate continuous, gauge, and characteristic meters directly. A continuous meter tracks cumulative values such as runtime hours or cycle counts. A gauge meter records fluctuating measurements such as vibration, temperature, or pressure. A characteristic meter captures qualitative observations such as oil color or asset cleanliness. Each meter type has different uses in scoring and predictive modeling, so choose deliberately when defining the meter hierarchy.
Gauge meters are the workhorse of condition-based maintenance. They let you define action and warning limits, which can trigger work orders, notifications, or meter-based preventive maintenance schedules. The critical design question is where the limits come from. Manufacturer recommendations are a starting point, but asset-specific operating context, historical failure data, and regulatory requirements should refine them. A pump running in a hot environment may need a different vibration threshold than the same pump in a climate-controlled facility.
Monitor also provides AI-powered anomaly detection. Instead of relying only on fixed thresholds, anomaly detection learns the normal operating behavior of the asset and flags deviations. This is especially useful for complex assets where a single threshold cannot capture the interaction between multiple variables. An anomaly on its own does not tell you what is wrong, but it tells you where to look, which is often the most valuable signal for a reliability engineer.
The following table summarizes the three meter types and their typical uses in a CBM workflow.
| Meter type | Data pattern | Typical CBM use |
|---|---|---|
| Continuous | Cumulative values such as runtime hours or cycle count | Trigger PM based on usage or operating time |
| Gauge | Fluctuating numeric values such as vibration, temperature, pressure | Compare to action and warning limits; feed scoring models |
| Characteristic | Qualitative observations such as oil color or cleanliness | Capture inspection findings and feed Health scoring |
Maximo Health: Scoring, Context, and Prioritization
Maximo Health takes the signals from Monitor, combines them with asset context and work history, and produces health scores. The score is not just a number; it is a structured view of asset condition that includes dimensions such as health, risk, criticality, end of life, and effective age. The exact scoring methodology depends on the asset class and the industry accelerator in use. For utilities, IBM provides the Maximo Health and Predict Utilities accelerator with prebuilt scoring models for transformers, switchgear, cables, and other grid assets.
The real value of Health is prioritization. A reliability engineer with ten thousand assets cannot inspect or maintain all of them. Health scores narrow the field to the assets most likely to need attention. The matrix view, which shows assets color-coded by two different scores, is particularly useful for identifying assets that are high risk and low health. These are the assets where predictive maintenance will have the biggest payoff.
Health also introduces confidence into the conversation. A declining health score tells a story. It says that something is changing and the organization understands why. This shifts the maintenance conversation from reacting to alarms to planning interventions based on trends. For the loop to be effective, the health scores must be explainable. Users need to see which meters, scores, and historical factors contributed to the result. If the score is a black box, planners will ignore it.
Configuring Health requires mapping the asset hierarchy, selecting scoring groups, defining the scoring calculations, and connecting the relevant data sources. In MAS 9.x, scoring groups can be connected to Watson Studio notebooks for more advanced calculations. The industry accelerators include default notebooks for common asset classes, which reduces the need to build models from scratch. For custom assets, reliability engineers and data scientists can develop their own notebooks and link them to the scoring group.
A well-designed Health configuration uses multiple scoring dimensions together. A single overall health score can hide important nuances. A transformer might have good electrical health but poor end-of-life scoring due to age. Another might have low health due to recent oil test results but low criticality because it serves a lightly loaded circuit. Showing the dimensions separately helps the reliability engineer decide what kind of action is appropriate.
Maximo Predict: Forecasting Failure and Degradation
Maximo Predict uses machine learning to forecast asset performance and maintenance needs. It analyzes time-series data from Monitor and failure data from Manage to build models that predict days to failure, probability of failure, or end of life. The models are trained on historical patterns and applied to current asset behavior to generate predictions.
There are two complementary modeling paths. The first path is prediction based on historical failure data. By analyzing corrective maintenance work orders, failure codes, root causes, repair frequency, and Mean Time Between Failure patterns, Predict learns how assets have failed in the past. This works well for repetitive assets with consistent failure modes. The second path is prediction based on condition and sensor data. Here, Predict learns from vibration, temperature, pressure, runtime, and degradation trends from Health. Instead of asking what failed before, it asks what behavior usually precedes a failure.
The real value of Predict is prioritization, not perfect foresight. Predict does not tell you exactly what will fail and when. It tells you where to look first so that limited inspection and maintenance resources are deployed against the highest-risk assets. A common mistake is to expect the model to replace engineering judgment. The better pattern is to use the model to rank candidates and let the reliability engineer validate the prediction with additional inspection or analysis.
Predict models require maintenance. Data drifts, asset operating conditions change, and new failure modes appear. Model accuracy should be monitored over time, and models should be retrained when accuracy drops or when significant operational changes occur. The training data must also be clean. Inconsistent failure codes, missing root causes, and incomplete work order histories will degrade model performance. This is why the Manage execution layer matters so much: the quality of the data captured during repair directly affects the next generation of predictions.
For administrators who need to inspect model results programmatically, the following pseudocode illustrates how to query high-risk assets from the Predict output through the MAS API. Adapt authentication and object structure names to your environment.
# Pseudocode to query Predict high-risk assets via MAS API
import requests
from datetime import datetime, timedelta

MAS_BASE = "https://mas-apm.example.com/maximo/oslc"
API_KEY = "your-api-key"

def get_predicted_failures(asset_class, risk_threshold):
    url = f"{MAS_BASE}/mxpredictoutput"
    params = {
        "oslc.select": "assetnum,siteid,predictiondate,probabilityoffailure,daysuntilfailure",
        "oslc.where": f"assetclass='{asset_class}' and probabilityoffailure>{risk_threshold}",
        "_lid": API_KEY
    }
    response = requests.get(url, params=params, verify=True)
    response.raise_for_status()
    return response.json().get("member", [])

high_risk = get_predicted_failures("PUMP", 0.7)
for record in high_risk:
    print(
        f"Asset {record['assetnum']} at {record['siteid']}: "
        f"{record['probabilityoffailure']:.0%} failure probability, "
        f"{record['daysuntilfailure']} days predicted"
    )
In production, you would also fetch the linked Health scores, create work queue entries or work orders through the appropriate MAS object structures, and log all actions for audit.
Reliability Strategies: From Condition to the Right Action
Knowing that an asset is degrading is only half the battle. The other half is deciding what to do about it. Reliability Strategies provides a content library of asset-specific failure details and mitigation activities developed by industry experts. The library covers hundreds of assets and tens of thousands of possible failures across known operating contexts. In MAS 9.x, the content library has been extended and the AI capabilities enhanced to build out failure and remediation descriptions.
The library is organized around failure modes, effects, and mitigation activities. A reliability engineer can select an asset class, review the recommended strategies, and align them with the organization's operating model. The Custom Strategies tab allows the creation of organization-specific strategies for assets that are not covered by the standard library. This is important because every organization has unique operating contexts, environmental conditions, and regulatory requirements.
Reliability Strategies also connects to Health, Job Plans, preventive maintenance, and meters. A strategy can specify the inspection frequency, the preventive maintenance task, the job plan to use, and the meter that triggers the intervention. This closes the loop from condition signal to planned action. When Health detects declining condition and Predict forecasts elevated risk, Reliability Strategies tells the planner what kind of work is appropriate and what tasks should be included.
The library is a starting point, not a replacement for engineering expertise. A reliability engineer should review each recommended strategy for applicability, adjust intervals based on local experience, and validate the outcomes. Over time, the organization builds its own reliability knowledge base, which can be reused across sites and asset classes.
Maximo Manage: Executing, Capturing, and Feeding Back
The Manage layer is where the loop closes. Work orders are created, approved, assigned, executed, and closed. Labor, materials, tools, and services are reported. Failure codes, root causes, and repair details are captured. This data becomes the training input for the next cycle of Predict models and the evidence used to validate Reliability Strategies recommendations.
For condition-based maintenance, the work order trigger can come from several sources. A gauge meter crossing a threshold can generate a work order automatically. A Health score dropping below a target can create a follow-up inspection. A Predict model forecasting high failure probability can generate a prioritized work queue. A Reliability Strategies recommendation can drive a preventive maintenance schedule or a one-time job plan assignment. The key design decision is how much automation is appropriate for each trigger.
A conservative starting pattern is to generate a notification or a work queue entry rather than a full work order. This lets the planner decide whether the signal is actionable. As the organization gains confidence, it can move to automatic work order creation for specific asset classes and trigger combinations. For example, a Predict score above a threshold combined with a criticality score above a threshold might automatically create an emergency work order, while a lower-risk combination creates a planned maintenance task.
The feedback loop depends on accurate work order closeout. The technician or supervisor must record the actual problem code, root cause, and repair action. If the work order simply says "repaired pump" without a failure code or root cause, the next Predict model has less to learn from. This is where Work Order Intelligence, discussed in the Maximo Manage deep dive, becomes relevant. Consistent failure coding at the point of closeout improves the entire APM cycle.
A practical example helps illustrate the loop. Consider a centrifugal pump with a vibration sensor and a temperature sensor. Monitor ingests both signals and updates the corresponding gauge meters. Health combines the meter readings with the pump's criticality and recent work history to produce a declining health score. Predict notices that the vibration trend resembles past bearing failures and forecasts a forty percent probability of failure within thirty days. The reliability engineer reviews the Predict high-risk queue and sees a Reliability Strategies recommendation to inspect the bearings and replace them if vibration exceeds the next threshold. The engineer creates a planned work order from the recommended job plan. After the work is completed, the technician records the failure code BEARING and the root cause LUBRICATION. That record feeds the next training cycle, making future predictions more accurate for similar pumps.
Practical Implementation Blueprint
Building the closed loop is a multi-phase project. A practical blueprint looks like this.
Phase one is data discovery. Identify the assets that are critical, data-rich, and failure-costly. Map the available data sources: historians, SCADA tags, IoT sensors, work order history, and asset registers. Define the meter hierarchy in Manage for each asset class. Verify that Monitor can ingest the data and that meters are updating as expected.
Phase two is scoring and baselining. Configure Health scoring groups for the selected assets. Use the industry accelerator if one is available, or connect a custom notebook. Establish baseline health scores and confirm that the scores move in the expected direction when operating conditions change. Validate the scoring with reliability engineers and domain experts before using it to drive decisions.
Phase three is prediction. Build Predict models for the highest-priority asset classes. Start with historical failure data models because they require less data engineering than sensor-based models. Validate model accuracy against a holdout set of historical failures. Once the failure-data models are stable, add sensor-based anomaly and degradation models.
Phase four is strategy alignment. Map Reliability Strategies recommendations to the asset classes and failure modes in scope. Connect the strategies to Job Plans, preventive maintenance records, and meters. Define the decision rules that translate Health and Predict outputs into actions.
Phase five is execution and feedback. Create the work order triggers or work queues. Train maintenance planners and supervisors on the new process. Monitor acceptance rates, false positive rates, and actual maintenance outcomes. Feed the results back into the scoring, modeling, and strategy configuration.
Common Pitfalls and Field-Tested Patterns
The most common pitfall is starting with too many assets at once. A pilot should focus on one asset class with good historical data and a clear business case. Transformers, pumps, motors, and compressors are common choices because they are well instrumented and have established failure modes. A focused pilot produces lessons that can be applied to broader rollouts.
The second pitfall is neglecting data quality. Sensor data must be time-aligned, missing values must be handled, and outliers must be investigated. Work order history must be accurately coded. Without clean data, the models will produce unreliable results and the organization will lose confidence.
The third pitfall is building models without involving domain experts. Data scientists can build accurate-looking models, but only reliability engineers can tell whether the model is predicting something meaningful. A model that forecasts bearing failure based on temperature alone may be ignoring lubrication history, load cycles, or maintenance quality. Domain expertise is essential for feature selection and model validation.
A fourth pitfall is automating work order creation too early. The first reaction to a new condition signal should be a review, not a work order. Planners need time to understand the signal, check the asset context, and decide on the right intervention. Premature automation creates a flood of low-value work orders and erodes trust in the system.
A fifth pitfall is treating Health, Predict, and Reliability Strategies as separate silos. They are most powerful when configured together. A Health score without a Predict model is reactive. A Predict model without a Reliability Strategy is just a forecast. A Reliability Strategy without Manage execution is a document. The loop only works when all five stages are connected and governed.
A field-tested pattern is to use work queues as the human-in-the-loop interface. Create a queue for assets with declining Health scores, a queue for Predict high-risk candidates, and a queue for anomaly alerts. A reliability engineer reviews the queues daily, selects the actionable items, and creates or approves work orders. This pattern gives the organization control while still benefiting from AI-driven prioritization.
Another useful pattern is the triage meeting. Once a week, the reliability engineer, maintenance planner, operations representative, and a data scientist review the current queue, discuss false positives, and decide whether any thresholds or models need adjustment. This meeting keeps the system honest and prevents the APM stack from drifting away from operational reality.
Practical Implications
Condition-based maintenance in MAS 9.x is no longer a collection of disconnected capabilities. The integration between Monitor, Health, Predict, Reliability Strategies, and Manage provides a genuine closed-loop path from sensor data to executed work. The practical implication is that the bottleneck shifts from technology to process design. Organizations must decide which assets to instrument, how to score condition, when to trust predictions, and how to translate signals into maintenance actions. The tools are capable, but the operating model determines whether the investment pays off.
For asset-intensive industries such as utilities, oil and gas, and manufacturing, the stakes are high. Unplanned failures can disrupt service, endanger safety, and trigger regulatory scrutiny. Condition-based maintenance cannot eliminate all failures, but it can shift the maintenance portfolio from reactive to proactive. The organizations that build the loop well will have more stable operations, lower emergency maintenance costs, and better capital planning.
Bottom Line
Maximo Health, Predict, Monitor, and Reliability Strategies give reliability engineers a complete toolkit for condition-based maintenance. Monitor brings in sensor data. Health scores condition and prioritizes assets. Predict forecasts failure and degradation. Reliability Strategies recommends the right intervention. Manage executes the work and captures the results. When these components are connected and governed by a clear operating model, maintenance shifts from calendar-driven to condition-driven. Start with a focused pilot, invest in data quality, keep humans in the loop early, and automate only after the signals have proven trustworthy. The organizations that follow this path will see fewer unexpected failures, better resource allocation, and a stronger foundation for predictive maintenance at scale.