Closed-Loop Reliability: How Maximo APM Turns Failure Analysis into Action
A technical exploration of IBM Maximo Asset Performance Management: Health, Reliability Strategies, Predict, and Monitor, and how they form a closed loop from failure analysis to work execution.

Closed-Loop Reliability: How Maximo APM Turns Failure Analysis into Action
For decades, asset management has been divided into two camps. One camp plans and executes maintenance. The other camp analyzes failures and predicts risk. They often use different tools, different vocabularies, and different budgets. The maintenance team lives in the enterprise asset management system, closing work orders and scheduling preventive tasks. The reliability team lives in spreadsheets, statistical packages, and specialized condition monitoring software. The result is a gap between analysis and action. A failure mode is identified, a recommendation is written, and then it sits in a report while the same assets continue to fail the same way.
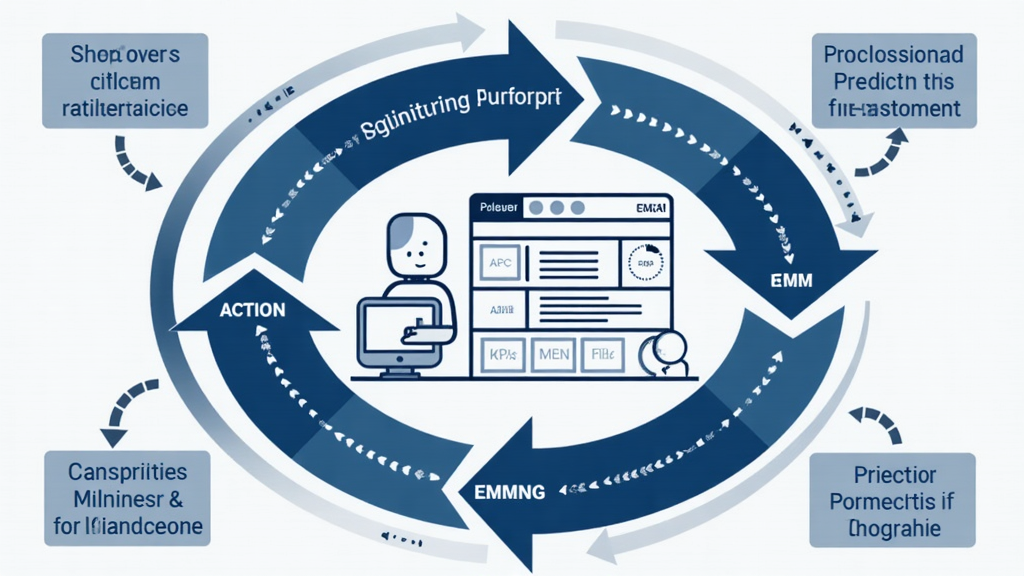
IBM Maximo Application Suite is closing that gap. The Asset Performance Management layer of MAS brings Reliability Strategies, Health, Predict, and Monitor together with Maximo Manage. The goal is a closed loop: failure analysis informs the maintenance strategy, the strategy drives sensor placement and monitoring, monitoring produces health scores and predictions, predictions trigger work orders, and the work execution data feeds back into the next cycle of failure analysis. This is not a marketing slide. It is an architecture that is increasingly operational in mature Maximo environments.
This article explains how the pieces fit together, what each component does, and what it takes to make the closed loop real. It is written for reliability engineers, asset managers, maintenance planners, and solution architects who are tired of disconnected reliability programs and want to understand how Maximo APM can integrate them. The focus is on the flow of data, the decisions at each handoff, and the practical patterns that make the loop work in production.
The APM Components and What They Do
Maximo Asset Performance Management is not a single application. It is a set of capabilities that can be deployed together or incrementally. The four core components are Health, Reliability Strategies, Predict, and Monitor. Each has a distinct role, but their value is greatest when they are connected.
Maximo Health provides the unified view of asset condition. It consumes operational data from Manage, Monitor, and external systems, then scores assets based on health, criticality, and risk. The output is a prioritized view of which assets need attention now, which ones can wait, and which ones are operating well. Health is the dashboard layer of APM. It answers the question: what is the current state of my asset base?
Maximo Reliability Strategies is the engineering layer. It supports Reliability-Centered Maintenance and Failure Modes and Effects Analysis. It includes an FMEA content library with equipment types, failure modes, and mitigation strategies. In recent releases, generative AI assists with creating asset-specific failure modes. The output of Reliability Strategies is a maintenance strategy: a set of preventive, predictive, condition-based, and run-to-failure tasks aligned to the asset's failure modes and operational context.
Maximo Predict is the machine learning layer. It builds models from time-series data and failure history to forecast days to failure, probability of failure, and other indicators. It uses data from Maximo Monitor for sensor readings and from Maximo Manage for failure events, work history, and asset attributes. The output is a prediction that can be turned into a recommended action.
Maximo Monitor is the data ingestion and anomaly detection layer. It connects to PLCs, SCADA systems, IoT devices, and other operational technology sources. It unifies the data, applies analytics pipelines, and raises alerts when measurements deviate from expected behavior. Monitor is the bridge between the operational technology world and the information technology world.
When these four components are connected to Maximo Manage, the result is a single platform where reliability engineering, condition monitoring, and maintenance execution share data. The same asset record, the same work order history, the same sensor data, and the same failure codes flow across the boundary between analysis and action. That is the closed loop.
From Failure Analysis to Maintenance Strategy
The loop starts with understanding how assets fail. This is the domain of Reliability Strategies. An RCM study asks seven questions about each asset function: what is the function, what are the functional failures, what are the failure modes, what are the effects, how does safety matter, how does operations matter, and what can be done to predict or prevent it. The answers produce a maintenance strategy.
The traditional challenge with RCM is scale. A full study for a large asset base can take months or years. It requires reliability engineers, maintenance experts, operations staff, and a facilitator who keeps the process honest. Many organizations never complete the study, or they complete it once and let it go stale. Maximo Reliability Strategies addresses this by providing a structured application for RCM studies and a pre-built FMEA content library. The library contains equipment types, failure modes, and maintenance tasks derived from decades of industry data. Instead of starting from a blank sheet, engineers start from a baseline and refine it for their specific operating context.
The generative AI capability in recent releases accelerates the creation of asset-specific failure modes. A reliability engineer can describe the asset and its operating conditions, and the system proposes failure modes based on the content library and similar assets. The engineer reviews, edits, and approves the result. This does not replace engineering judgment. It removes the blank-page problem and helps teams scale RCM across thousands of assets instead of dozens.
The output of a Reliability Strategies study is a set of mitigation strategies linked to failure modes. These strategies include preventive maintenance tasks, predictive maintenance tasks, condition monitoring points, and redesign or operational changes. The strategies are then pushed into Maximo Manage as PM records, job plans, routes, or meter definitions. This is the first critical handoff in the closed loop. If the handoff is manual or inconsistent, the strategy dies in the analysis tool. If it is automated and governed, the strategy becomes a living part of the maintenance program.
From Maintenance Strategy to Condition Monitoring
Once the strategy defines what to monitor and how often, the next step is to instrument the asset. Maximo Monitor ingests time-series data from sensors and control systems. The monitoring points are aligned with the condition monitoring points defined in the reliability strategy. This alignment is what prevents organizations from drowning in sensor data that has no clear decision path.
A common mistake in condition-based maintenance programs is to instrument everything and then wonder what to do with the data. The correct sequence is to define the failure modes, identify the measurable indicators that reveal those failure modes, and then place sensors to capture those indicators. Reliability Strategies provides the context for Monitor. Without that context, Monitor produces alerts that nobody trusts because they are not tied to a known failure mechanism.
Maximo Monitor provides out-of-the-box connectors and analytics pipelines for common industrial protocols and data sources. It can ingest high-frequency time-series data, aggregate it, and apply anomaly detection models. When an anomaly is detected, Monitor can raise an alert in the unified APM dashboard, trigger a notification, or write the measurement back into Maximo Manage as a meter reading. That meter reading can then drive a condition-based maintenance work order through a PM or an escalation.
The integration between Manage and Monitor is bidirectional. Manage sends asset master data, locations, and work history to Monitor so that sensor data is contextualized. Monitor sends measurements, alerts, and anomaly scores back to Manage so that maintenance actions can be triggered. This bidirectional flow is the backbone of condition-based maintenance in MAS. It replaces the old pattern where condition monitoring data lived in a separate historian and maintenance decisions were made by email or spreadsheet.
From Monitoring to Health and Prediction
With sensor data flowing and failure history recorded, the next layer becomes possible. Maximo Health combines health indicators, asset criticality, and risk scoring to produce a unified asset health view. Health can ingest data from Manage and Monitor, including inspection results, work order history, meter readings, and sensor anomalies. It then applies scoring methodologies to produce health scores that can be viewed in a matrix, a list, or a dashboard.
The unified dashboard in MAS is a useful operational view. It shows asset and location performance in one place, with matrix views, automated analysis, work history, and drill-down into sensor and inspection data. For a reliability engineer or asset manager, this is the view that replaces the morning ritual of opening five different applications to figure out what is broken today. It also supports the reliability tab in the Asset and Locations dashboard, which displays failure history and total maintenance cost alongside health data.
Maximo Predict takes the next step. It uses the time-series data from Monitor and the failure data from Manage to build predictive models. These models forecast days to failure, probability of failure, and other indicators for specific assets or asset classes. The models are not generic industry averages. They are trained on the organization's own data, which means their accuracy depends on the quality and completeness of that data.
This is where the closed loop starts to pay off. A prediction from Predict can be converted into a recommended action in Health, which can be converted into a work order in Manage. The work order can include the predicted failure mode, the recommended mitigation task, and the sensor readings that triggered the prediction. When the technician completes the work, the outcome feeds back into the failure history that trains the next generation of models. The loop completes and begins again.
A Production Example: Pump Bearing Failure Program
To make the closed loop concrete, consider a mid-sized water utility with two hundred critical pumps. Over the past three years, the utility experienced twelve unplanned pump failures due to bearing degradation. The average repair cost, including emergency labor, expedited parts, and production losses, was roughly forty thousand dollars per event. The reliability team decided to build a closed-loop program around bearing failure using the MAS APM components.
The first step was a Reliability Strategies RCM study for the pump class. The team identified the critical function as moving water at the required flow rate and pressure. The functional failure was inability to maintain flow or pressure. The dominant failure mode was bearing degradation due to vibration, temperature, and lubrication contamination. The team selected continuous vibration monitoring and periodic oil analysis as the primary condition monitoring points. The mitigation strategy included a condition-based PM triggered by vibration thresholds, a predictive model trained on vibration trends, and a preventive lubrication task on a fixed interval.
The second step was instrumenting the pumps. Vibration sensors were installed on the bearing housings of the two hundred critical pumps. The data was streamed through the SCADA system into Maximo Monitor. In Monitor, the team built analytics pipelines that calculated rolling averages, detected anomalies, and compared current readings against baselines established during normal operation. An alert was configured when vibration exceeded the ninety-fifth percentile baseline for the asset class.
The third step was integrating Monitor with Manage. The vibration reading was written to a meter on the pump asset record. A condition-based PM was defined with meter frequency triggers. When the meter reading crossed the threshold, Maximo generated a work order for vibration analysis and bearing inspection. The PM job plan included the correct inspection procedure, the required tools, and the spare bearing part number if replacement was needed.
The fourth step was building the Predict model. The team fed Predict three years of vibration time series from Monitor and the twelve historical failure events from Manage. The model learned the vibration signature that preceded failures. After validation, it began generating thirty-day probability of failure scores for each pump. Pumps with scores above seventy percent were flagged in Health and added to the planner's recommendation queue.
The fifth step was work execution and feedback. Technicians completed the condition-based and predictive work orders through Maximo Mobile in the field. Closeout data included measured vibration values, bearing condition findings, corrective actions, and whether the pump returned to baseline. That data flowed back into Health to update the asset score and into Predict to retrain the model. The cycle repeated monthly.
The table below compares the maintenance strategy types used in this program.
| Strategy Type | Trigger | Action | MAS Component |
|---|---|---|---|
| Preventive | Fixed calendar interval | Lubrication and visual inspection | Reliability Strategies & Manage PM |
| Condition-based | Vibration meter threshold | Vibration analysis and inspection | Monitor & Manage CBM PM |
| Predictive | ML model probability > 70% | Planned bearing replacement | Predict & Health recommendation |
| Reactive | Unplanned failure | Emergency repair | Manage work order |
The program did not eliminate all unplanned failures, but it reduced bearing-related unplanned downtime substantially in the first eighteen months. The exact improvement depends on the baseline, but the operational discipline was the real win. The utility now had a single system of record for the pump class failure mode, the sensor data, the prediction, the work history, and the feedback.
Model Training and Data Quality Considerations
Predictive models are not magic. They are statistical pattern matchers, and their usefulness depends on the data they are trained on. In the pump example, the model was trained on only twelve failure events. That is a small number for most machine learning techniques, but it is a realistic number for critical assets. The team addressed this by combining the failure events with a larger set of historical anomalies and degradation windows. They also used asset class-level modeling rather than individual asset modeling for the first iteration, which allowed the model to learn from the fleet rather than from a single pump.
Data quality is the most common obstacle to APM success. Assets must have consistent master data: asset number, classification, manufacturer, model, install date, and criticality. Failure events must be coded consistently using the same failure codes across work orders, work logs, and failure reports. Sensor data must have reliable timestamps and minimal gaps. Work order closeout must record the actual condition found, not just a generic completion note. These are not technology requirements. They are data governance requirements, and they usually require more organizational effort than the software configuration.
A practical pattern is to create a data readiness checklist before enabling Predict. The checklist should cover asset master data completeness, failure code standardization, meter data availability, work order history depth, and integration validation between Manage and Monitor. Each item should have a pass-fail criterion and an owner. If the checklist is not green, the model will produce noise. It is better to delay predictive modeling by three months and fix the data than to deploy a model that the maintenance team stops trusting.
The Work Execution Feedback Loop
The handoff from prediction to work order is where many APM programs fail. A dashboard shows a red health score, but no work order is created. A model predicts failure in thirty days, but the planner never sees it. The work execution feedback loop is what prevents this. It connects the analytical output to the maintenance process that already exists in Maximo Manage.
There are several ways to trigger work from APM insights. A health score threshold can trigger an escalation that creates a work order. A predicted failure can generate a recommendation that a planner reviews and converts to a work order. A Monitor anomaly can write a meter reading that triggers a condition-based PM. A Reliability Strategies mitigation can create a PM or a route. The right mechanism depends on the maturity of the organization and the criticality of the asset.
For high-criticality assets, automation may be appropriate. A predicted bearing failure on a critical pump might automatically generate a work order, notify the planner, and reserve parts. For lower-criticality assets, a recommendation queue may be more appropriate. The planner reviews the recommendation, validates it against the current schedule, and converts it to a work order. The recommendation queue is a governance layer that prevents automated alerts from overwhelming the maintenance team.
The feedback loop also requires good work order closeout data. When a technician completes a predictive or condition-based work order, the closeout should include the actual condition found, the parts used, the labor hours, the corrective action, and the outcome. This data feeds back into Health for updated scoring, into Predict for model retraining, and into Reliability Strategies for strategy refinement. If the closeout data is incomplete or inaccurate, the loop degrades. Garbage in, garbage out applies to APM as much as any other system.
Practical Implications
For organizations building or maturing an APM program, the practical implications are significant. First, do not try to deploy all four components at once. Start with the component that addresses your biggest pain point. If you have too many unplanned failures, start with Reliability Strategies and build a maintenance strategy. If you have sensor data but no decision path, start with Monitor and connect it to Manage. If you have data but cannot prioritize, start with Health. If you have enough history to model, start with Predict. Second, data quality is the foundation. APM models are only as good as the data they learn from. Invest in asset master data, failure codes, work order closeout discipline, and sensor data governance before investing in advanced analytics.
Third, governance is not optional. The closed loop generates recommendations and alerts at scale. Someone must decide which ones become work orders, which ones are deferred, and which ones are rejected. Without governance, the system produces noise and the maintenance team stops trusting it. Fourth, connect the reliability team and the maintenance team early. If the two teams are not aligned on failure modes, criticality, and work priorities, the technology will not fix the organizational gap. Fifth, measure outcomes. Track unplanned downtime, maintenance cost, mean time between failures, and asset availability before and after APM deployment. The technology is justified by operational results, not by dashboard screenshots.
Bottom Line
Maximo Asset Performance Management is not a replacement for Maximo Manage. It is an extension that turns Manage from a work execution system into a closed-loop reliability platform. The components of APM, Health, Reliability Strategies, Predict, and Monitor, each have a clear role. Together they connect failure analysis, maintenance strategy, condition monitoring, health scoring, prediction, and work execution in a single digital thread. The organizations that succeed with APM are the ones that treat it as an operational program, not a technology purchase. They start with a clear problem, invest in data quality, build governance, and measure results. The closed loop does not close itself. It closes when people and process are aligned around the data.